CapExplorer is a 3D model of an AI data center that you can take apart, piece by piece, to see where the money goes.
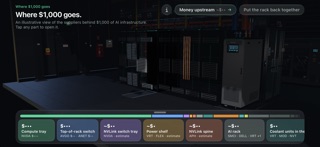
Start at a single AI server rack. Tap "See where $1,000 goes" and the rack pulls apart into its parts, each labelled with its share of $1,000 of data center spending and the companies that supply it. A bar along the bottom shows the whole split at a glance.
HOW YOU EXPLORE
• The rack: compute trays, switches, the power shelf, the copper spine and the rack itself, each with its dollar share.
• Inside the parts: open a compute tray to see its GPUs, memory, CPUs, boards, cold plates and network cards, then follow the chips back to the fab and the lithography machine that prints them.
• The money upstream: a flow diagram of the spending that is already inside the $1,000, from chipmakers to the toolmakers and software vendors they pay.
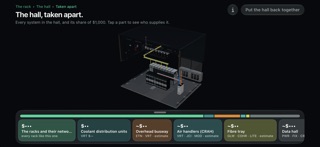
• The data hall: step back to see the hall around the rack, then take it apart: coolant units, overhead busway, air handlers, containment and fibre tray.
• The hall's systems: each one opens in its own level, from the pumps and heat exchanger of a coolant unit to the switchgear, UPS, transformers and generators behind the busway.
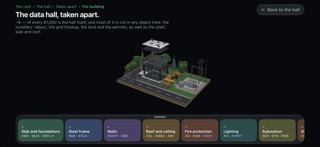
• The building and the site: zoom out to the whole building on its plot, with slab, steel frame, walls, roof, substation and an excavator at work, and see how much of the cost is labour, land, permits and the grid connection rather than equipment.
WHO GETS PAID
Every part lists the publicly traded companies that make it, by ticker. Companies listed outside the US are shown by the symbol a US investor would use and marked as ADRs or foreign listings. Open a company to see its latest annual revenue and profit, with a link to the filing it comes from.
SOURCED FIGURES
The dollar figures are illustrative estimates built from cited public sources: company filings, teardown and bill-of-materials analyses, and industry research. Every panel lists its sources, and estimates are marked as estimates, with a range where one is available. The model shows one plausible split of spending; real projects vary.
EDUCATIONAL, NOT ADVICE
CapExplorer is an educational tool for understanding how AI infrastructure is built and paid for. It is not investment advice, and it does not recommend buying or selling any security. Company names and tickers are shown for identification only; CapExplorer is not affiliated with or endorsed by any of the companies it mentions.
PRIVATE AND OFFLINE
• Works fully offline: the models and data are in the app.
• No account, no sign-in.
• No ads, no analytics, no tracking. No data is collected.
Built for iPad in any orientation and iPhone in landscape