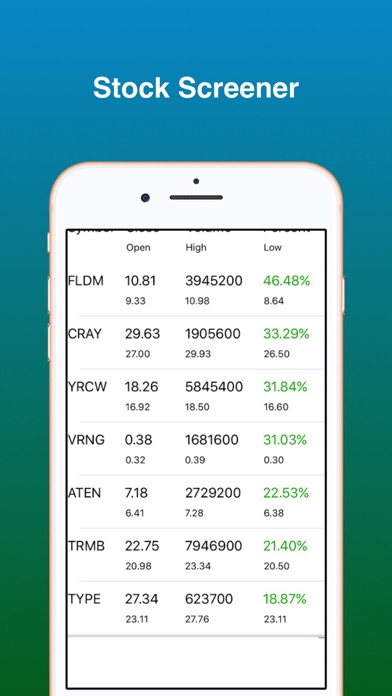
Stock Screener is a free stock market app that search the US stock market based on technical analysis and stock chart patterns for stock trading. This is a technical stock screener or stock scanner, not a fundamental stock screener.
If you do online stock trading, such as swing trading or day trading, you will like this stock screener app for iPhone. You can find stocks that you want to trade to your stocks to watch list. This is an end of day technical analysis stock screener, meaning the stock quotes are updated at the end of the day. We do not offer real time stock quotes for our technical stock screener.
You need to have a basic understand of how the stock market works in order to utilize this technical analysis app.
This free stock screener app does not teach you how to trade stocks, nor does it recommend you any stocks to buy. You have to do your own stock market research and buy stocks on your own risk.
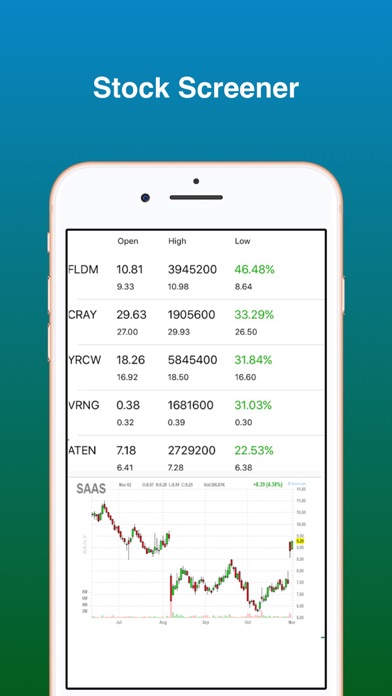
The stock charts within this app are from Finviz. They have copyright to the stock chart. The stock charts uses intraday data which is delay by 15 minutes.
There are many technical indicators that you can scan the stock market for swing trading. You will see stock charts and stock market news when you click on any stock on the result page.
This stock scanner scans for stocks based on technical indicators only, it does not have any of the fundamental analysis data like PE ratio. If you are looking for a fundamental stock screener, this app is not for you.
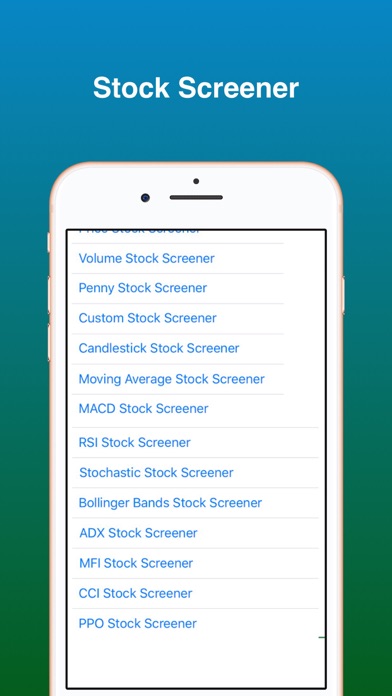
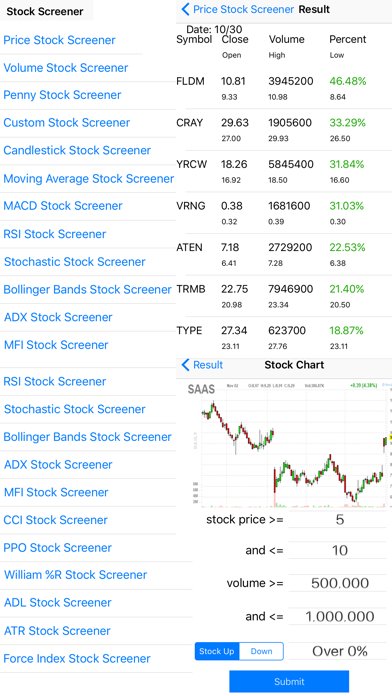
Below is a list of the most popular stock chart patterns and technical indicators that you can use with our technical stock screener app.
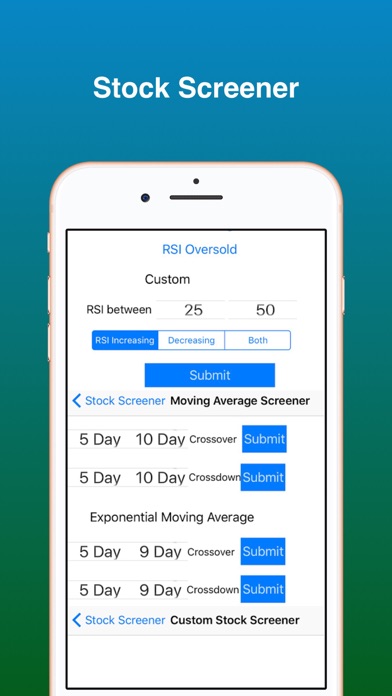
RSI Stock Screener - RSI Screener find oversold and overbought stocks and stocks with RSI increasing or decreasing.
MACD Stock Screener - Macd Screener search for MACD crossover, cross down patterns.
Moving Average Stock Screener - Moving average crossovers generate bullish signal. You can add stocks to your watchlist when these crossover occurs. You can use both moving average and exponential moving average.
Daily Stock Gainers and Losers - Get top stock market gainers and losers.
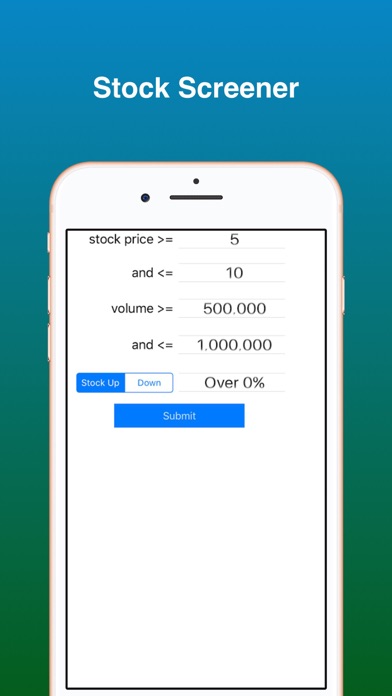
Price Stock Screener - search stocks based on stock prices.
Volume Stock Screener - search stocks base on high volume stocks or stocks with unusual volume.
Penny Stock Screener - search for small cap stocks and penny stocks under $1, stocks under $5, stocks under $10.
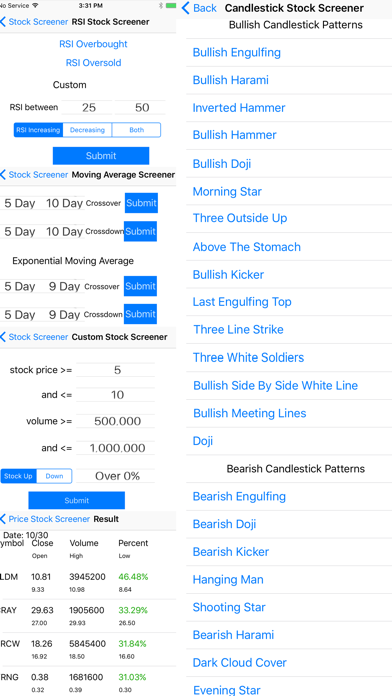
Candlestick Stock Screener - candlestick screener allows you to scan for the most popular candlestick patterns.
Bollinger Band Stock Screener - Bollinger Band is a nice chart pattern to see when you should get in or get out from a stock. The idea is when the stock price moves above the upper bollinger band, it is time to sell. When the stock price moves above the lower bollinger band, it is time to buy.
Stochastic Stock Screener - Stochastic can be use as a leading indicator when you use it to find overbought and oversold stocks.
ADX Stock Screener - ADX is a technical indicator to measure the strength of a stock trend without regard to its direction. Our ADX screener gives you the ability to scan for stocks with strong trends.
MFI Stock Screener - is a technical indicator that uses stock price and volume to measure buying and selling pressure. It can also be used to find oversold and overbought stocks.
CCI Stock Screener - identify stock trend or warning of extreme conditions when a stock is overbought or oversold.
William %R Stock Screener - technical indicator to find overbought and oversold stocks.
Force Index Stock Screener - technical indicator that uses stock price and volume to identify strength of a stock trend.
ADL Stock Screener - is a technical indicator to measure the money flow into and out of a stock. It is a similar indicator with the OBV indicator.
ATR Stock Screener - is a technical indicator to measure the volatility of a stock.
This is one of the best stock screener app for iPhone that you can use for free.